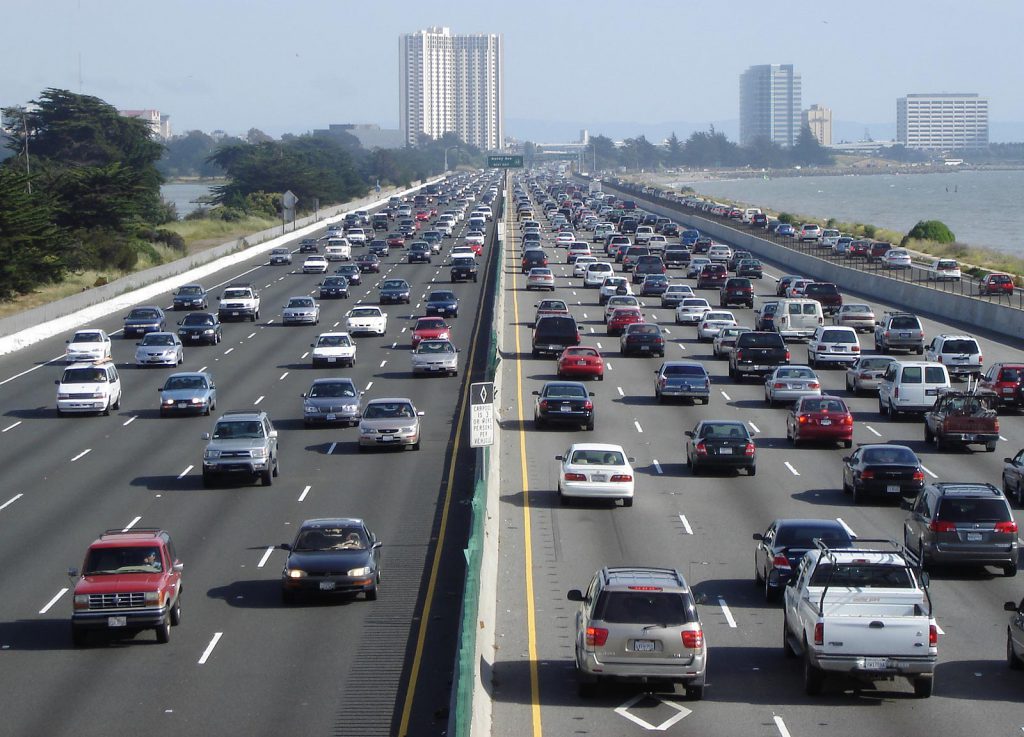
Which cities have the longest commute?

Every year it can feel like your commute is getting longer and longer, but increased work-from-home seems to have leveled off the trend to 27 minutes.1 However, the average U.S. motorist spent 51 hours sitting in traffic last year —15 hours more than in 2021. Luckily that remains 50% lower than the pre-pandemic high of 99 hours in 2019.2 Here are top cities to avoid if you’d rather not spend more time in your car.
The Three Worst Commutes
Stockton, California (#1) takes the top spot on our list with an average daily commute of 33 minutes. Located 90 minutes east of San Francisco adds to the likelihood of residents making a long commute to the Bay Area, and 17% of workers have a commute lasting over an hour.3
At #2 on the list is Bakersfield, California. Being situated over 100 miles from Los Angeles surely increases commute length to the LA area. 6.6% of workers commute over one hour, but that volume has increased by 2.4% over the same time period — the highest increase across all cities in a study.3
Everything is bigger in Texas, and with 86.1% of Garland, Texas commuters, it comes in #3 on our big commutes list. Situated on the outskirts of Dallas, drivers needing to navigate all the freeways feeding that metropolis. The average Garland commuter drives roughly 30 minutes, but about 9.1% drive over one hour.3
Long Commutes and Health
And those hours spent sitting in our cars do not merely make us less happy. They also make us less healthy. Recent studies, have shown a correlation between long commutes and obesity, neck pain, loneliness, divorce, stress, and insomnia.4 Why do people choose to put themselves through these long commutes? For many people they would rather live further away from their place of employment if it means being able to live in a larger, less expensive home. One day all this may be remedied by self-driving cars, which will free us up to do whatever we please while being whisked to and from work, but in the meantime, might we suggest subscribing to a few more podcasts to help pass the time?
Who is Answer Financial?
As one of the nation’s largest and most reputable auto & home insurance agencies, Answer Financial has insured nearly 5 million homes and vehicles. We work with 40+ top-rated carriers to save our customers an average of $565 a year on insurance.*
On our mobile-friendly website, shoppers can quickly compare rates and customize coverages from multiple home insurers. By simply entering your zip code and home address, Answer can search publicly available records like square footage and year built to deliver side-by-side comparison quotes from reputable insurance companies.
Answer Financial can help you compare, buy and often save the smart way on insurance. So before you shop, remember to rely on your insurance experts to find you the right home insurance plan for your needs and budget.
September 15, 2023
Sources:
- gov, “FOTW #1284, April 3, 2023: Average Travel Time to Work Was About 27 Minutes in 2021,” https://www.energy.gov/eere/vehicles/articles/fotw-1284-april-3-2023-average-travel-time-work-was-about-27-minutes-2021
- Forbes, “These Are The Cities Where Motorists Lose The Most Time And Money Sitting In Traffic,” https://www.forbes.com/sites/jimgorzelany/2023/01/10/these-are-the-us-cities-where-motorists-lose-the-most-time-and-money-sitting-in-traffic/?sh=1936185e4f1d
- Smart Asset, “Cities Where Residents Have the Worst Commutes – 2023 Edition,” https://smartasset.com/data-studies/cities-where-residents-have-the-worst-commutes-2023
- Huffington Post, “7 Ways Your Commute Is Wrecking Your Health And Relationships,” https://www.huffpost.com/entry/ways-commute-wrecking-health-relationships_l_62323ba7e4b02d624b1a4a17
